Posted in: Comics | Tagged:
DC Comics Beat Marvel On Retail Marketshare-Per-Capita in February
Yeah, looks like we're doing this every month now. A Marketshare-Per-Capita chart. The usual marketshare shows how much share of the overall market a publisher has, this divides it by the number of titles they publish.
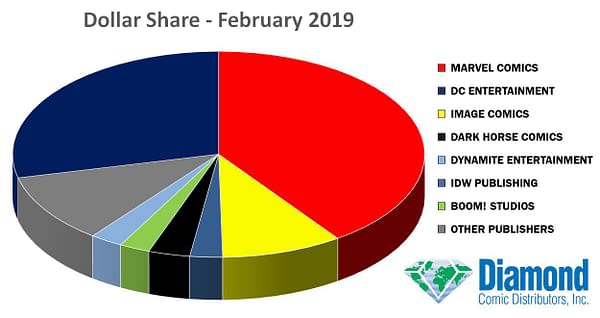
We've already looked at publisher marketshare in the North American direct market of comic book shops for February 2018, with Marvel Comics again dominating. And looked at the top 100 ordered comics and graphic novels for the month.
But if you divide the marketshare by the number of individual titles published that month, you get a different picture. In January, Marvel still beat DC on both counts, in February, DC had a greater retailer marketshare per item distributed than Marvel, though brought in less revenue. This closing of the stats was due to Marvel shipping 126 items in February, to DC's 88.
Dynamite also continues to outperform, unly just below Image for February, and way above Dark Horse, IDW and others, while Oni Press also outperforms with a greater per capita share than both IDW and Boom. And Valiant seems to be dropping, rather…
I hope this is a conversation point.
| Publisher | Retail Marketshare Per Capita x1000 | Dollar Marketshare Per Capita x1000 |
| DC COMICS | 326 | 348 |
| MARVEL COMICS | 319 | 353 |
| IMAGE COMICS | 143 | 141 |
| DYNAMITE | 122 | 112 |
| DARK HORSE | 87 | 70 |
| ONI PRESS | 80 | 56 |
| IDW PUBLISHING | 77 | 67 |
| BOOM! STUDIOS | 76 | 73 |
| TITAN COMICS | 58 | 48 |
| RANDOM HOUSE | 52 | – |
| ZENESCOPE ENTERTAINMENT INC | 45 | 38 |
| AFTERSHOCK COMICS | 45 | 45 |
| ARCHIE COMICS | 45 | 43 |
| VALIANT | 34 | 34 |
| ST. MARTINS PRESS | 29 | 7 |
Here are the overall marketshare stats for comparison, however, as well as the titles published chart, in case you would like to verify my working out.
| RETAIL MARKET SHARE | |
| PUBLISHER | SHARE |
| MARVEL COMICS | 40.20% |
| DC ENTERTAINMENT | 28.69% |
| IMAGE COMICS | 9.49% |
| DARK HORSE COMICS | 3.25% |
| DYNAMITE ENTERTAINMENT | 2.58% |
| IDW PUBLISHING | 2.55% |
| BOOM! STUDIOS | 2.38% |
| VIZ MEDIA | 1.78% |
| ST. MARTINS PRESS | 0.60% |
| ONI PRESS | 0.56% |
| ARCHIE COMICS | 0.54% |
| RANDOM HOUSE | 0.52% |
| TITAN COMICS | 0.52% |
| AFTERSHOCK COMICS | 0.45% |
| ZENESCOPE ENTERTAINMENT INC | 0.36% |
| FANTAGRAPHICS BOOKS | 0.32% |
| AVATAR PRESS INC | 0.31% |
| COFFIN COMICS | 0.28% |
| VALIANT ENTERTAINMENT LLC | 0.27% |
| LION FORGE | 0.26% |
| OTHER NON-TOP 20 | 4.08% |
| UNIT MARKET SHARE | |
| PUBLISHER | SHARE |
| MARVEL COMICS | 44.48% |
| DC ENTERTAINMENT | 30.64% |
| IMAGE COMICS | 9.30% |
| DARK HORSE COMICS | 2.58% |
| DYNAMITE ENTERTAINMENT | 2.35% |
| BOOM! STUDIOS | 2.26% |
| IDW PUBLISHING | 2.20% |
| VIZ MEDIA | 0.67% |
| ARCHIE COMICS | 0.51% |
| AFTERSHOCK COMICS | 0.45% |
| TITAN COMICS | 0.43% |
| ONI PRESS | 0.39% |
| ZENESCOPE ENTERTAINMENT INC | 0.30% |
| VALIANT ENTERTAINMENT LLC | 0.27% |
| ACTION LAB ENTERTAINMENT | 0.21% |
| ASPEN MLT INC | 0.21% |
| ANTARCTIC PRESS | 0.17% |
| ST. MARTINS PRESS | 0.16% |
| COFFIN COMICS | 0.15% |
| AVATAR PRESS INC | 0.15% |
| OTHER NON-TOP 20 | 2.11% |
| PUBLISHER | COMICS SHIPPED |
GRAPHIC NOVELS SHIPPED |
MAGAZINES SHIPPED |
TOTAL SHIPPED |
| MARVEL COMICS | 86 | 40 | 0 | 126 |
| DC | 59 | 28 | 1 | 88 |
| IMAGE COMICS | 47 | 19 | 0 | 66 |
| DARK HORSE COMICS | 24 | 13 | 0 | 37 |
| IDW PUBLISHING | 22 | 11 | 0 | 33 |
| BOOM! STUDIOS | 21 | 10 | 0 | 31 |
| VIZ MEDIA | 0 | 27 | 0 | 27 |
| DYNAMITE ENTERTAINMENT | 20 | 1 | 0 | 21 |
| SEVEN SEAS ENTERTAINMENT | 0 | 21 | 0 | 21 |
| ONI PRESS | 4 | 3 | 0 | 7 |
| OTHER NON-TOP 10 | 106 | 131 | 22 | 259 |
| TOTAL | 389 | 304 | 23 | 716 |


