Posted in: Comics | Tagged: per capita
Fantagraphics In Fourth Place in February 2020 Marketshare-Per-Capita chart
Welcome to Bleeding Cool's Monthly 'Per Capita' List. The usual comics industry marketshare shows how much share of the overall market a comics publisher has. But the Per Capita list takes that figure and divides it by the number of new titles they publish in that month. We've already looked at publisher marketshare in the North American direct market of comic book shops for February 2020.
But if you divide the marketshare by the number of individual titles published that month, you get a very different picture. Marvel still tops DC – but nowhere near as much. Some pricey but high-performing archive collections such as the Pogo strips boost Fantagraphics' performance to fourth, but Boom, IDW, Aftershock and Dark Horse squeeze out Dynamite which outperformed them all last month.
| Publisher | Dollar Marketshare Per Capita x1000 | Retail Marketshare Per Capita x1000 |
| MARVEL COMICS | 301 | 340 |
| DC COMICS | 223 | 232 |
| IMAGE COMICS | 128 | 115 |
| FANTAGRAPHICS | 107 | 13 |
| BOOM! STUDIOS | 103 | 106 |
| IDW | 91 | 83 |
| AFTERSHOCK | 83 | 66 |
| DARK HORSE | 79 | 105 |
| DYNAMITE | 64 | 61 |
| VIZ MEDIA | 56 | 61 |
| VALIANT | 55 | 54 |
| ONI PRESS | 54 | 45 |
| TITAN COMICS | 43 | 35 |
| ZENESCOPE | 40 | 48 |
| VAULT | 34 | 37 |
| ACTION LAB | 33 | 29 |
| ARCHIE COMICS | 30 | 29 |
| YEN PRESS | 23 | 8 |
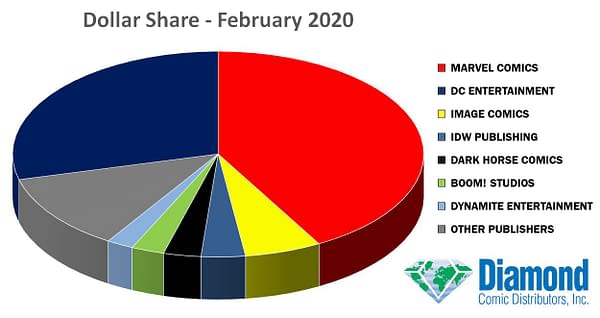 |
| Dollar Market Share – January 2020 |
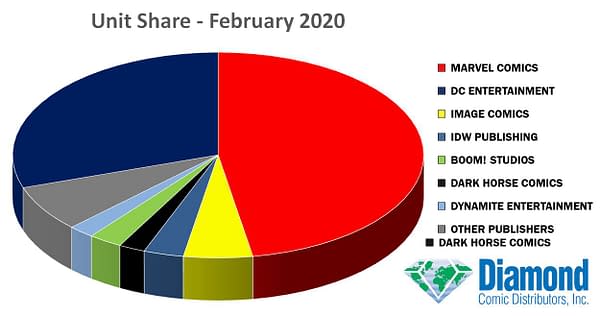 |
| Unit Market Share – January 2020 |


